Fruit Juice Plant KPI Dashboard for Yield, Viscosity, and Filtration Control
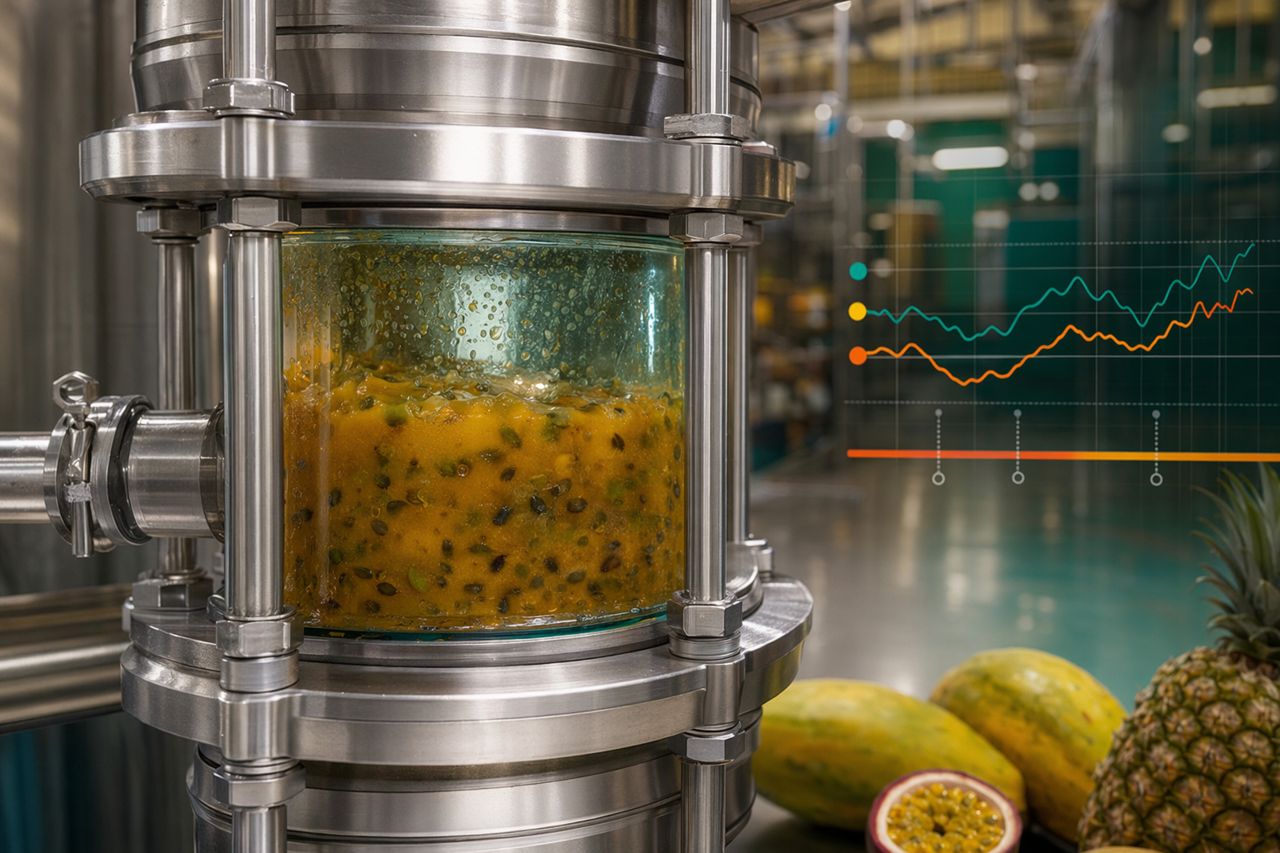
Tropical fruit campaigns move fast. Mango can arrive thick and fibrous. Pineapple can shift with maturity and pulp load. Passion fruit and guava can push clarification and filtration systems into uneven operating windows.
For a production manager, the useful question is not simply whether an enzyme treatment worked. The useful question is: where did the batch improve, where did variation enter, and what should be adjusted before the next run?
This framework is built for a tropical fruit juice plant using enzyme processing to control mash behavior, improve extraction, accelerate clarification, and reduce filtration pressure. It is also written for teams comparing an enzyme supplier for fruit juice processing based on measurable plant outcomes rather than generic claims.
The dashboard objective
A practical juice plant KPI dashboard should connect enzyme use to operational performance across the line:
- Fruit intake and mash preparation
- Enzyme dosing point and retention conditions
- Pressing or decanting performance
- Clarification speed
- Centrifuge or filter load
- Final juice consistency
- Cleaning time and unplanned stoppages
The dashboard should not be a lab-only report. It should be a production control tool that helps supervisors decide whether to hold, adjust, divert, blend, or proceed.
Core KPI group 1: mash viscosity
Mash viscosity is often the earliest sign that a batch will either run cleanly or consume capacity downstream.
Track viscosity at defined process points:
- After milling or pulping
- After enzyme addition and retention
- Before pressing, decanting, or separation
- At the feed point to clarification or filtration
What to watch
- Slow viscosity reduction despite standard retention time
- High batch-to-batch variation within the same fruit campaign
- Thick mash causing uneven pump load or feed instability
- Excessive hold time required before press loading
Why it matters
Lower and more consistent mash viscosity can support steadier pumping, improved press loading, better juice release, and fewer operator interventions. For fruit such as mango, guava, papaya, and passion fruit, viscosity control can become the difference between a predictable shift and a bottlenecked one.
Core KPI group 2: press yield and extractable juice
Yield tracking should separate raw fruit variation from process performance. A simple yield number at the end of the day is useful, but not enough.
Track:
- Fruit lot, variety, maturity band, and storage time
- Mash feed quantity
- Juice recovered at the press or decanter
- Pomace moisture trend
- Re-press requirement
- Hold time before pressing
Dashboard signal
If enzyme-treated mash shows lower viscosity but yield does not improve, the constraint may be press loading, contact time, fruit maturity, or mechanical settings. If yield improves but filtration load rises, the treatment may be releasing more soluble and fine material than the downstream system can comfortably handle.
The goal is not maximum release at any cost. The goal is usable yield that the plant can clarify, filter, and pack without creating a new restriction.
Core KPI group 3: clarification speed
Clarification speed is a direct measure of how efficiently the juice transitions from pulp-rich process flow to a more stable liquid stream.
Track:
- Turbidity trend after enzyme treatment
- Time required to reach the plant target
- Centrifuge performance or settling response
- Volume held in clarification tanks
- Rework or re-clarification events
What good looks like
A stable enzyme program should compress clarification time while reducing the spread between batches. For plants running multiple fruits or blended bases, consistency can be as valuable as peak speed because it protects scheduling and tank availability.
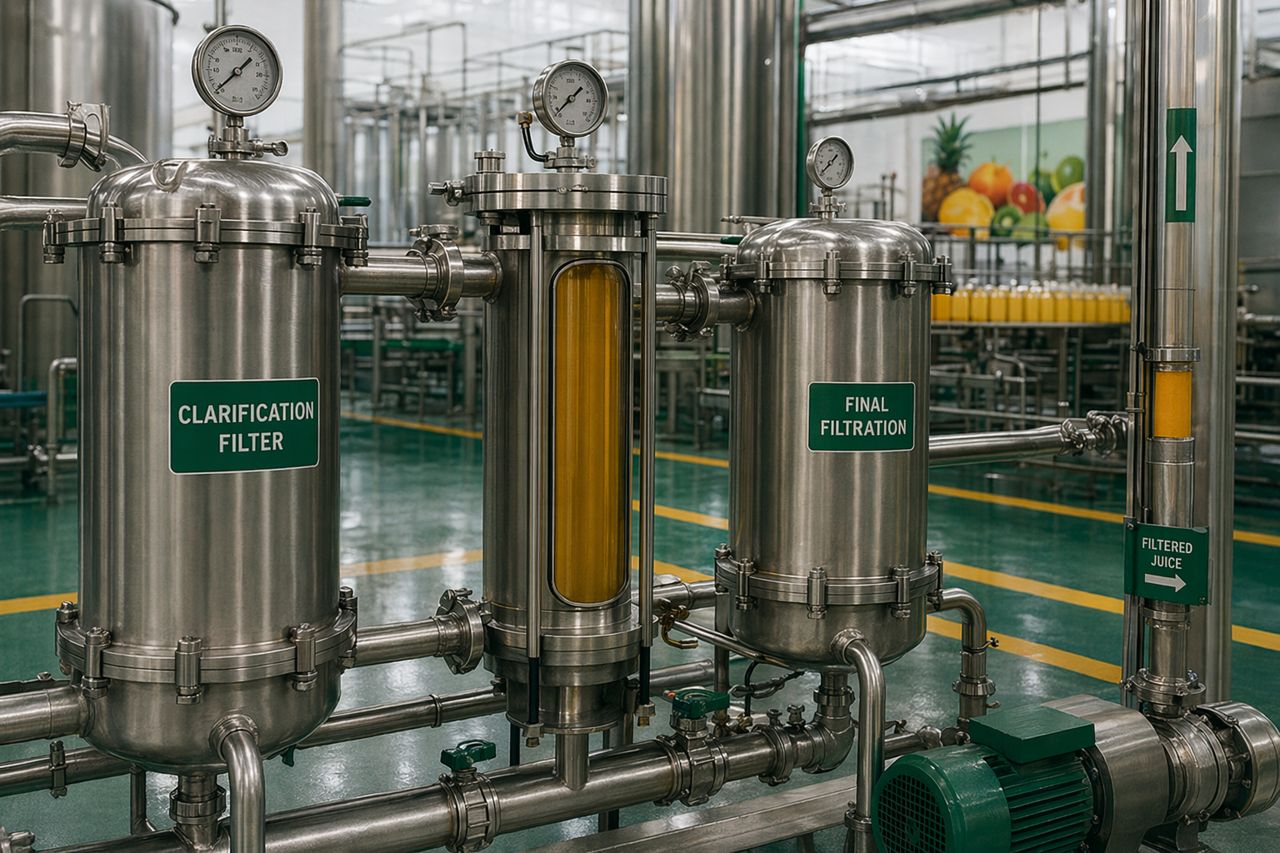
Core KPI group 4: filtration load
Filtration is where earlier process choices become visible. A batch that looks acceptable after pressing can still create heavy filter loading if pectin, suspended solids, or fine pulp remain poorly controlled.
Track:
- Filter pressure rise pattern
- Flow decline over the run
- Filter change frequency
- Backflush or cleaning frequency
- Juice volume processed per filter cycle
- Downtime linked to blocked screens or filters
Operational interpretation
A strong enzyme program should help reduce filtration resistance and extend stable run time. If filter load increases after a formulation change, review the entire chain: fruit lot, milling intensity, enzyme selection, dosing location, retention time, temperature window, and separation settings.
Core KPI group 5: batch consistency
Tropical fruit processing is campaign-driven, and raw material variation is unavoidable. The dashboard should make variation visible early enough to adjust.
Useful consistency indicators include:
- Viscosity spread between lots
- Turbidity spread after clarification
- Press yield variation by fruit lot
- Brix and pH trend by receiving batch
- Hold time required to meet process targets
- Operator adjustment frequency
Practical target
Do not only track the average. Track the spread. A plant that improves average yield but increases process variability may still lose time, labor, and filter capacity.
Core KPI group 6: downtime and intervention points
Downtime data makes the dashboard commercially relevant. Enzyme selection should be connected to lost minutes, stoppages, and cleaning load.
Track downtime caused by:
- Pump strain from thick mash
- Press feed instability
- Slow tank turnover
- Centrifuge imbalance or high solids load
- Filter blockage
- Extra cleaning cycles
- Rework or delayed release
When downtime is tied to batch identity and enzyme conditions, the plant can identify whether the issue is raw material, process setup, or treatment design.
Recommended dashboard structure
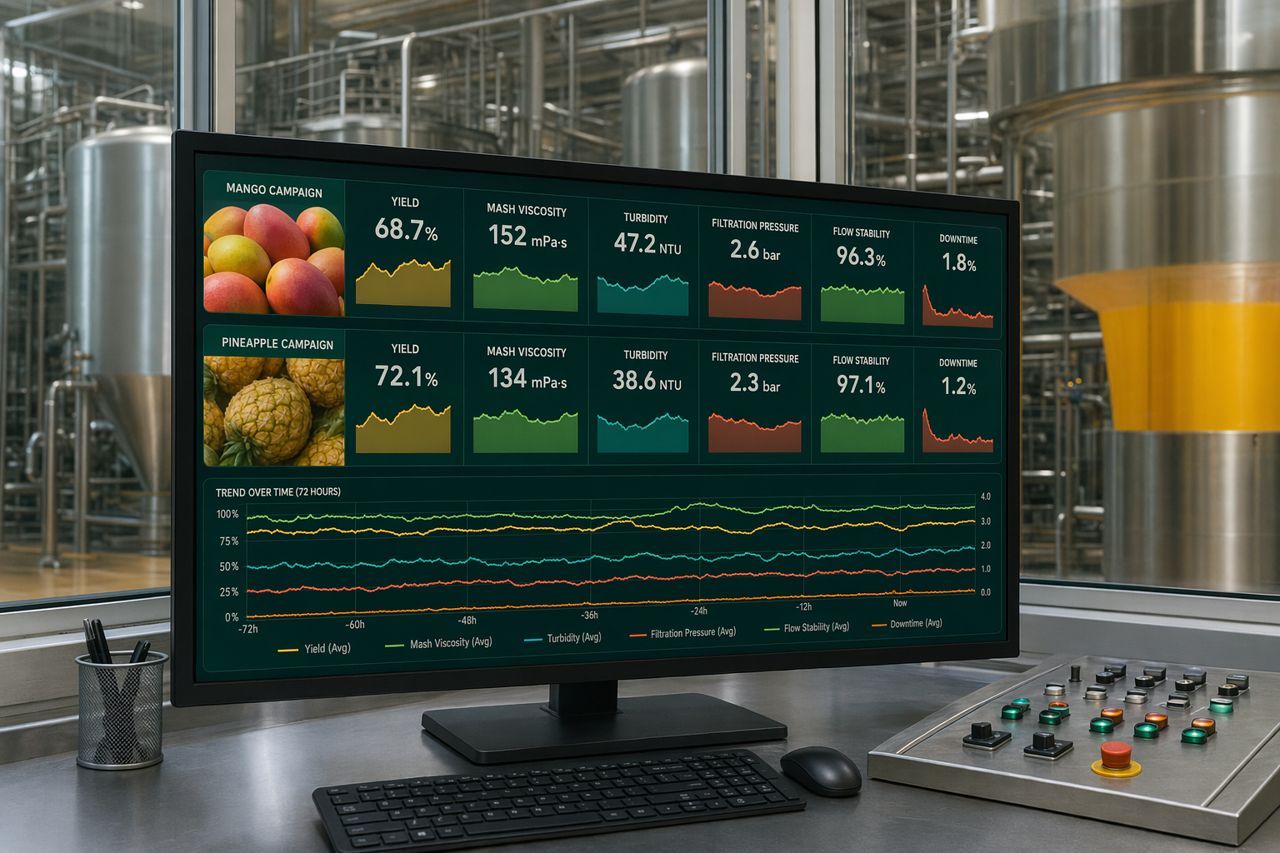
A useful dashboard can be built around six columns:
- Fruit input: fruit type, variety, maturity, storage time, lot identity
- Mash condition: temperature, pH, pulp load, viscosity trend
- Enzyme treatment: product, dosing point, mixing quality, retention window
- Extraction performance: press yield, pomace condition, throughput
- Clarification and filtration: turbidity, pressure trend, flow stability, filter life
- Plant impact: tank turnover, rework, cleaning, downtime, operator interventions
This structure allows supervisors to review each batch as a connected process rather than a set of disconnected measurements.
How to use the dashboard during an enzyme trial
When trialing an enzyme supplier, avoid changing too many variables at once. A clean trial should compare performance under controlled plant conditions.
Before the trial
- Select one fruit stream or blend where the current constraint is clear
- Define the primary KPI: yield, viscosity, clarification time, filtration load, or downtime
- Agree the standard operating window for temperature, pH, mixing, and retention
- Establish the baseline from recent production data
- Decide how many batches are needed to capture fruit variation
During the trial
- Log fruit lot and process conditions for every batch
- Use the same sampling points each time
- Record operator interventions, not just instrument readings
- Compare downstream impact, not only immediate mash response
- Review results with production, quality, maintenance, and procurement together
After the trial
- Compare average improvement and variation reduction
- Identify any bottleneck that moved downstream
- Estimate recoverable value from yield, time, filter life, and downtime
- Confirm whether the enzyme program is robust enough for campaign variation
Common dashboard mistakes
Mistake 1: measuring only final yield
Final yield matters, but it does not show whether the process became easier or harder to run. A batch may recover more juice but still overload filtration.
Mistake 2: ignoring retention conditions
Enzyme performance depends on contact, mixing, temperature, pH, and process timing. If retention is inconsistent, batch results will be inconsistent.
Mistake 3: treating all tropical fruits the same
Mango, pineapple, guava, papaya, and passion fruit present different pulp structures, pectin behavior, fiber levels, and clarification challenges. The dashboard should allow fruit-specific baselines.
Mistake 4: separating quality and production data
Quality readings should be connected to throughput and downtime. A clear juice that takes too long to produce may not be the best production outcome.
Where Enzymeforjuice fits
Enzymeforjuice supplies enzyme solutions for fruit juice plants that need measurable control over mash viscosity, extraction, clarification, and filtration behavior. Our approach starts with the plant constraint, then builds the enzyme recommendation around the fruit stream, processing window, equipment layout, and commercial KPI.
We do not expect production teams to accept broad claims without validation. The strongest enzyme program is one that can be trialed, measured, and repeated under real campaign conditions.
Request a quote for your fruit juice line
If your plant is reviewing enzyme supply for mango, pineapple, guava, papaya, passion fruit, or blended tropical bases, share your process constraint and target KPI with our technical team.
Request a quote using the on-site contact form and include the fruit stream, process stage, current bottleneck, and the KPI you want to improve.